Centerton Real Estate Market: April 2025 Market Update

Welcome to your April 2025 market update. I'm Allie Verdery—your local advisor, also known as The Blue Haired Broker with Engel & Völkers Bentonville. Whether you’ve attended Coffee with the Mayor or simply keep an eye on our community's growth, you know I’m committed to making Centerton’s real estate trends accessible, informed, and actionable. This month’s snapshot offers a data-driven look at how our market is performing and how Centerton compares across Northwest Arkansas.
Average Sales Price
-
Centerton: Jumped up $44,618 from $471,287 in March to $515,905 in April
-
Bentonville: Dropped $22,778 from $623,472 in March to $600,694 in April
-
Siloam Springs: Dropped $50,986 from $343,228 in March to $292,242 in April
-
Northwest Arkansas: Stayed about the same month over month, rising $1,014 from $449,873 in March to $450,887 in April
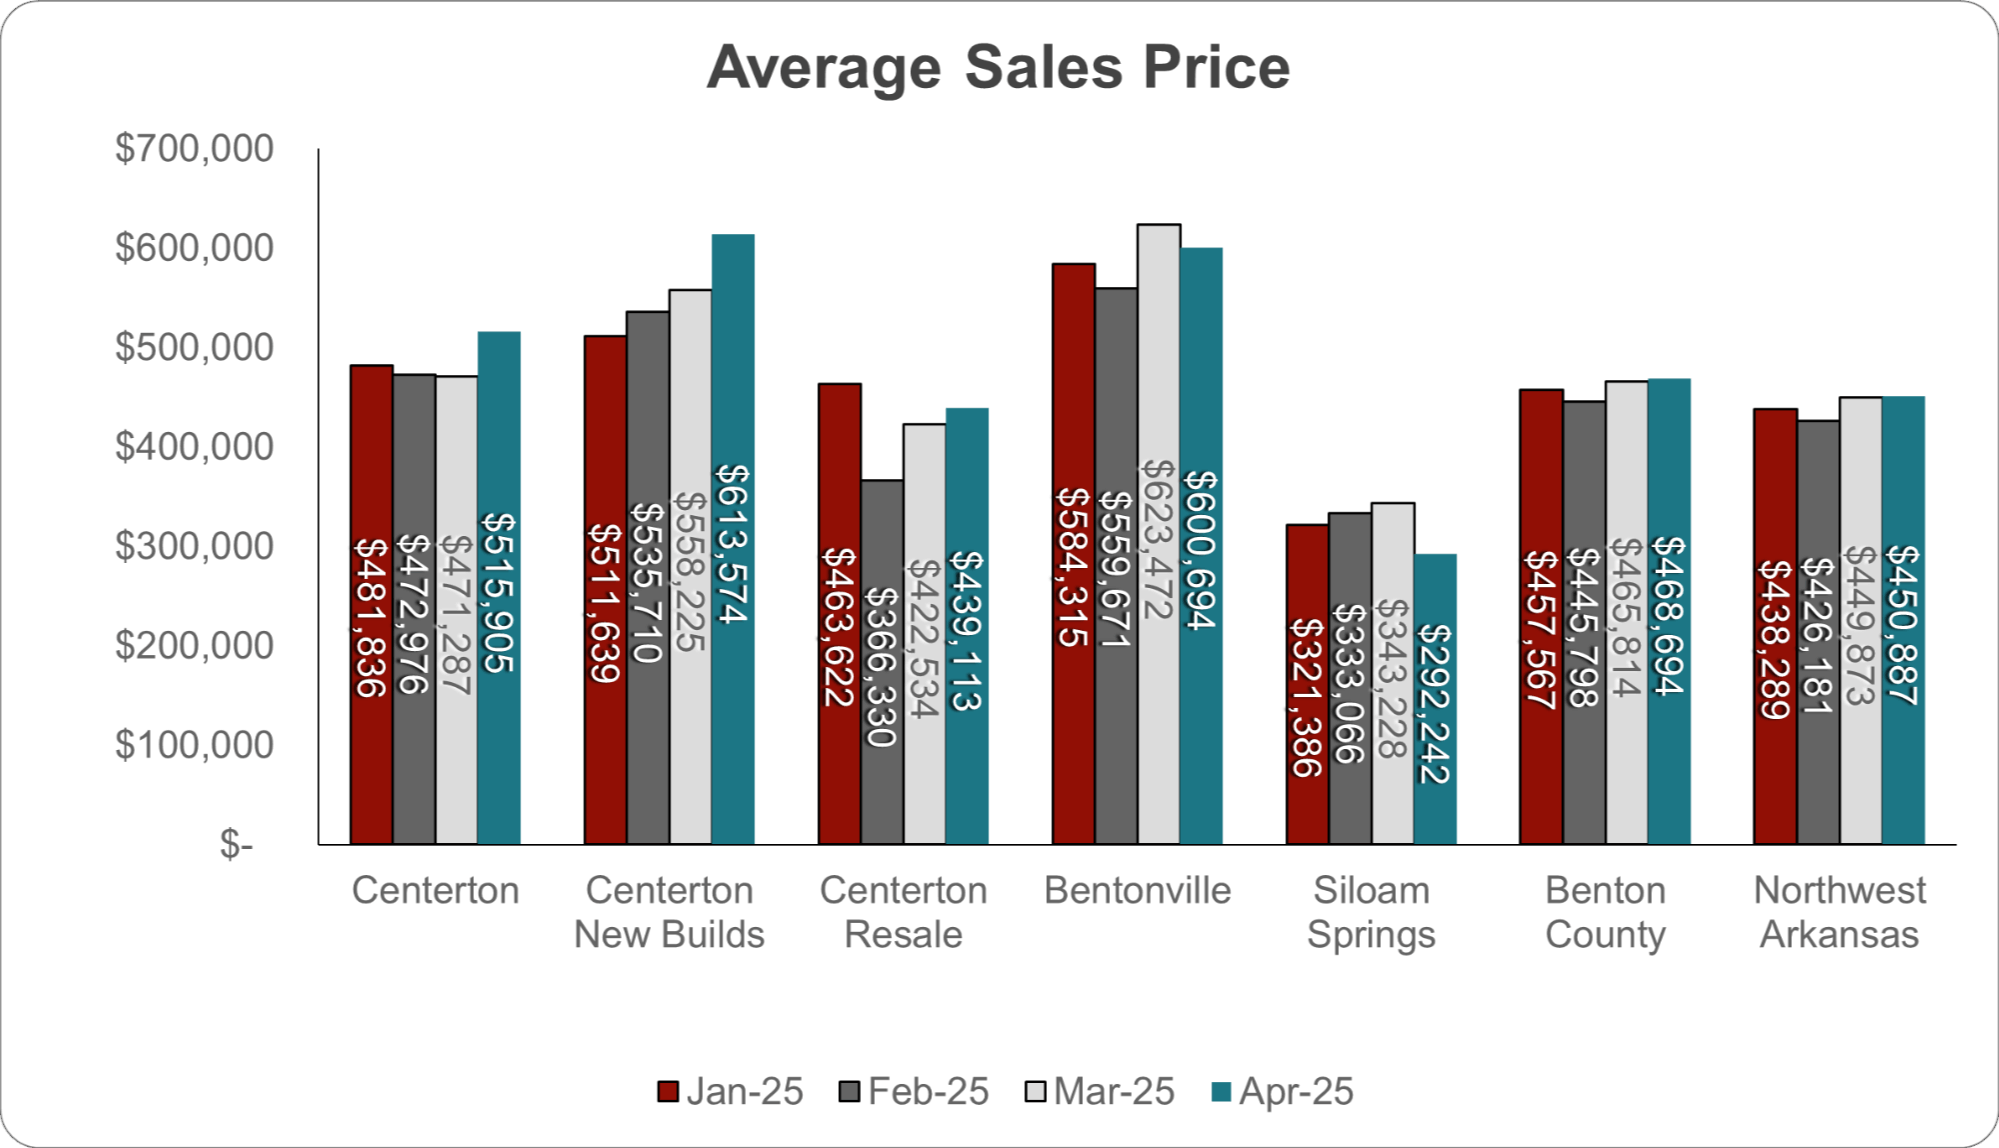
Centerton posted one of the strongest month-over-month price increases in the region for April, with average sales prices jumping over $44,000. This sharp rise indicates growing demand, particularly for larger or more upgraded homes, and underscores Centerton’s continued popularity with both local and relocating buyers. While other cities like Bentonville and Siloam Springs saw mixed or declining trends, Centerton’s pricing trajectory points to healthy buyer activity and strong perceived value.
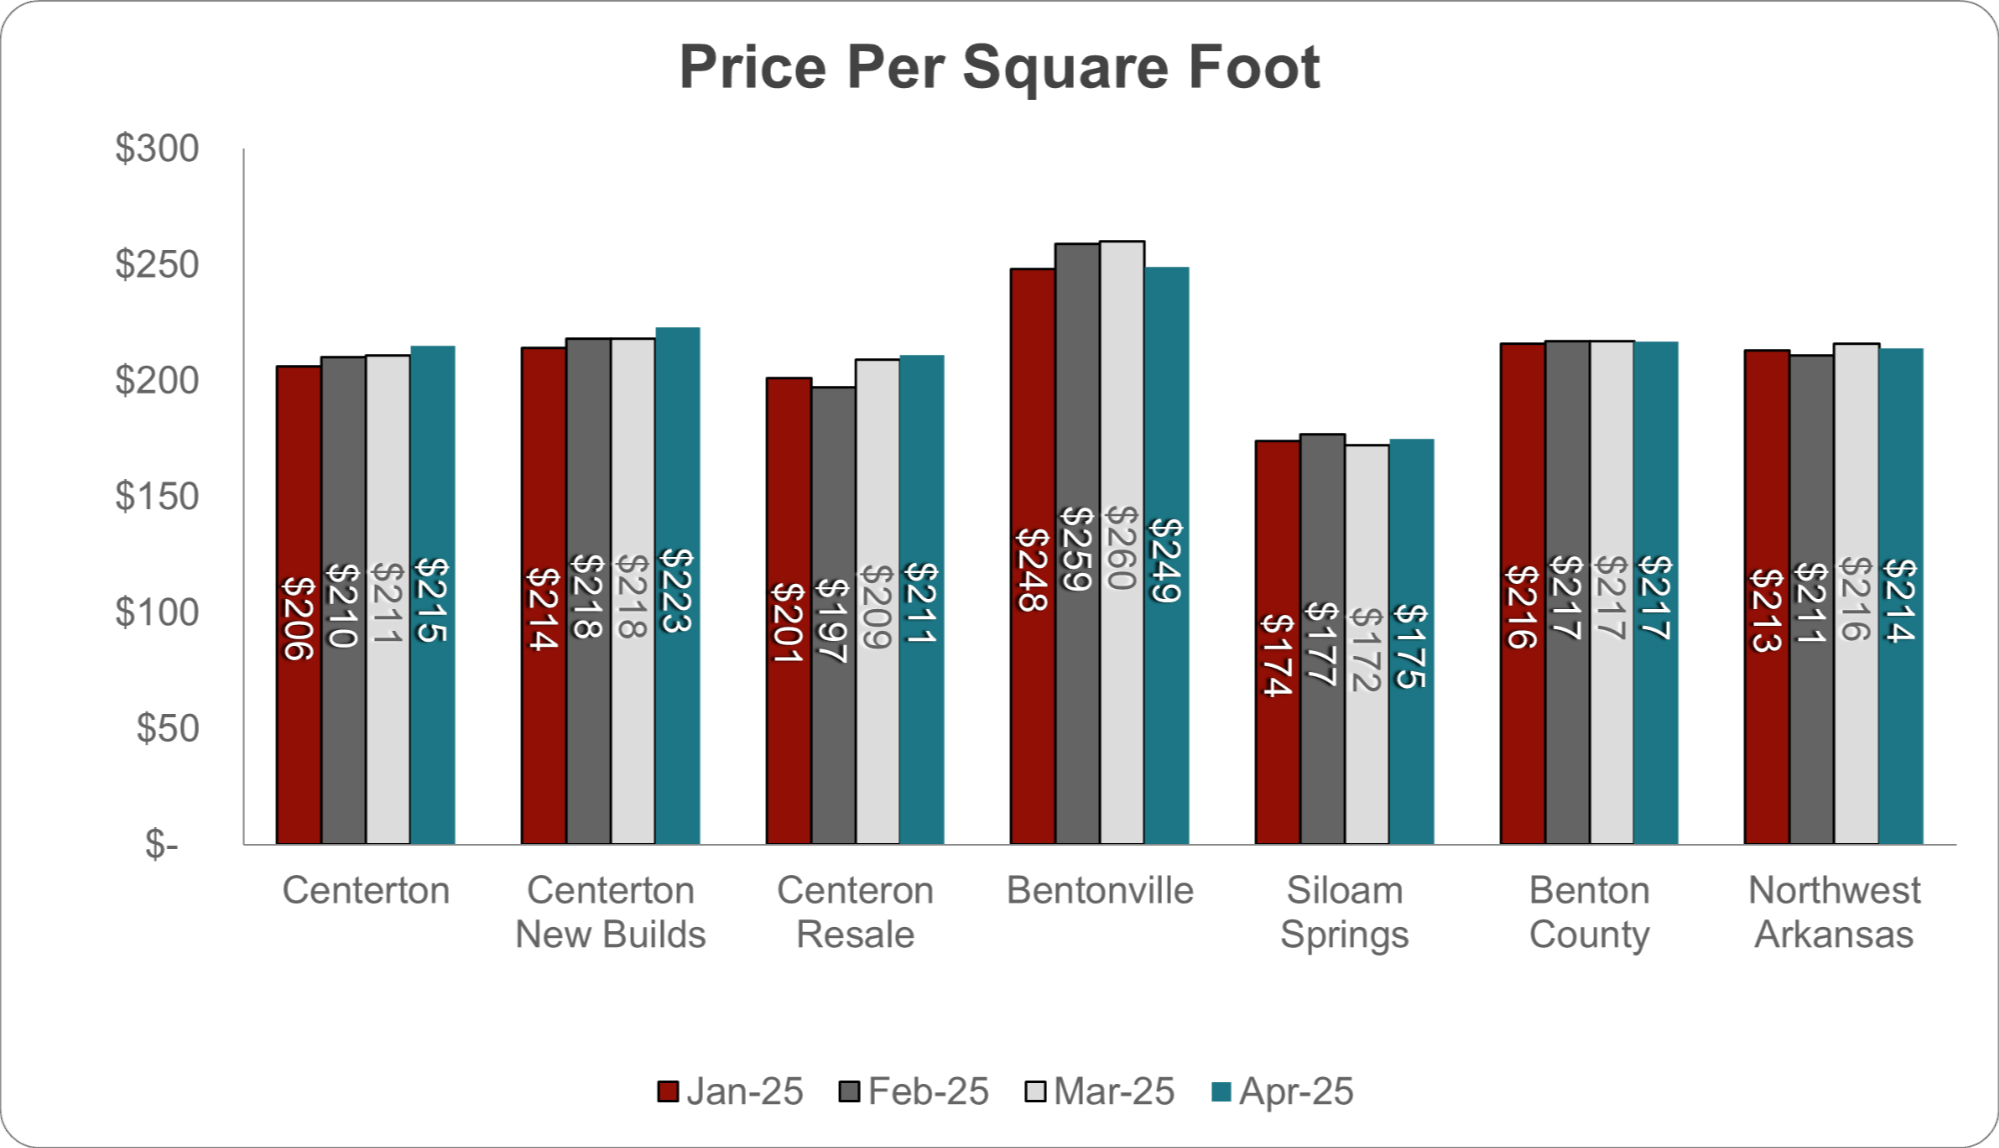
Price per Square Foot
-
Centerton: Rose $4/sq ft from $211/sq ft in March to $215/sq ft in April
-
New Construction: Up $5/sq ft from $218 in March to $223/sq ft in April
-
Non-New Construction: Up $2/sq ft from $209/sq ft in March to $211/sq ft in April
-
-
Bentonville: Dropped $11/sq ft from $260/sq ft in March to $249/sq ft in April
-
Siloam Springs: Rose $3/sq ft from $172/sq ft in March to $175/sq ft in April
-
Northwest Arkansas: Rose $2/sq ft from $209/sq ft in March to $211/sq ft in April
If the numbers look a little different than last month, it's because I realized the previous data included both active listings and closed sales. Only sold listings reflect the actual final prices, so this month’s report has been adjusted to show only closed sales for the most accurate market view.
Centerton's average price per square foot rose modestly in April, up $4 from the month prior. Both new construction and existing homes saw slight gains. This uptick, while modest, reinforces the broader trend of buyer demand continuing to support pricing even as more homes come to market. By contrast, Bentonville saw a notable decline, which makes Centerton’s steady climb especially notable in today’s shifting conditions.
Days on Market
Days on Market gives us insight into how long homes are taking to sell—from listing to contract (CDOM), and from listing to close (Days to Sell). It’s one of the clearest ways to measure buyer urgency and transaction flow.
-
Centerton:
-
CDOM dropped from 70 days in March to just 41 days in April
-
Days to Sell fell sharply from 146 days to 74
-
-
Bentonville:
-
CDOM improved from 61 days to 50
-
Days to Sell remained steady, from 94 to 93
-
-
Siloam Springs:
-
CDOM rose slightly from 67 to 70 days
-
Days to Sell increased from 94 to 106
-
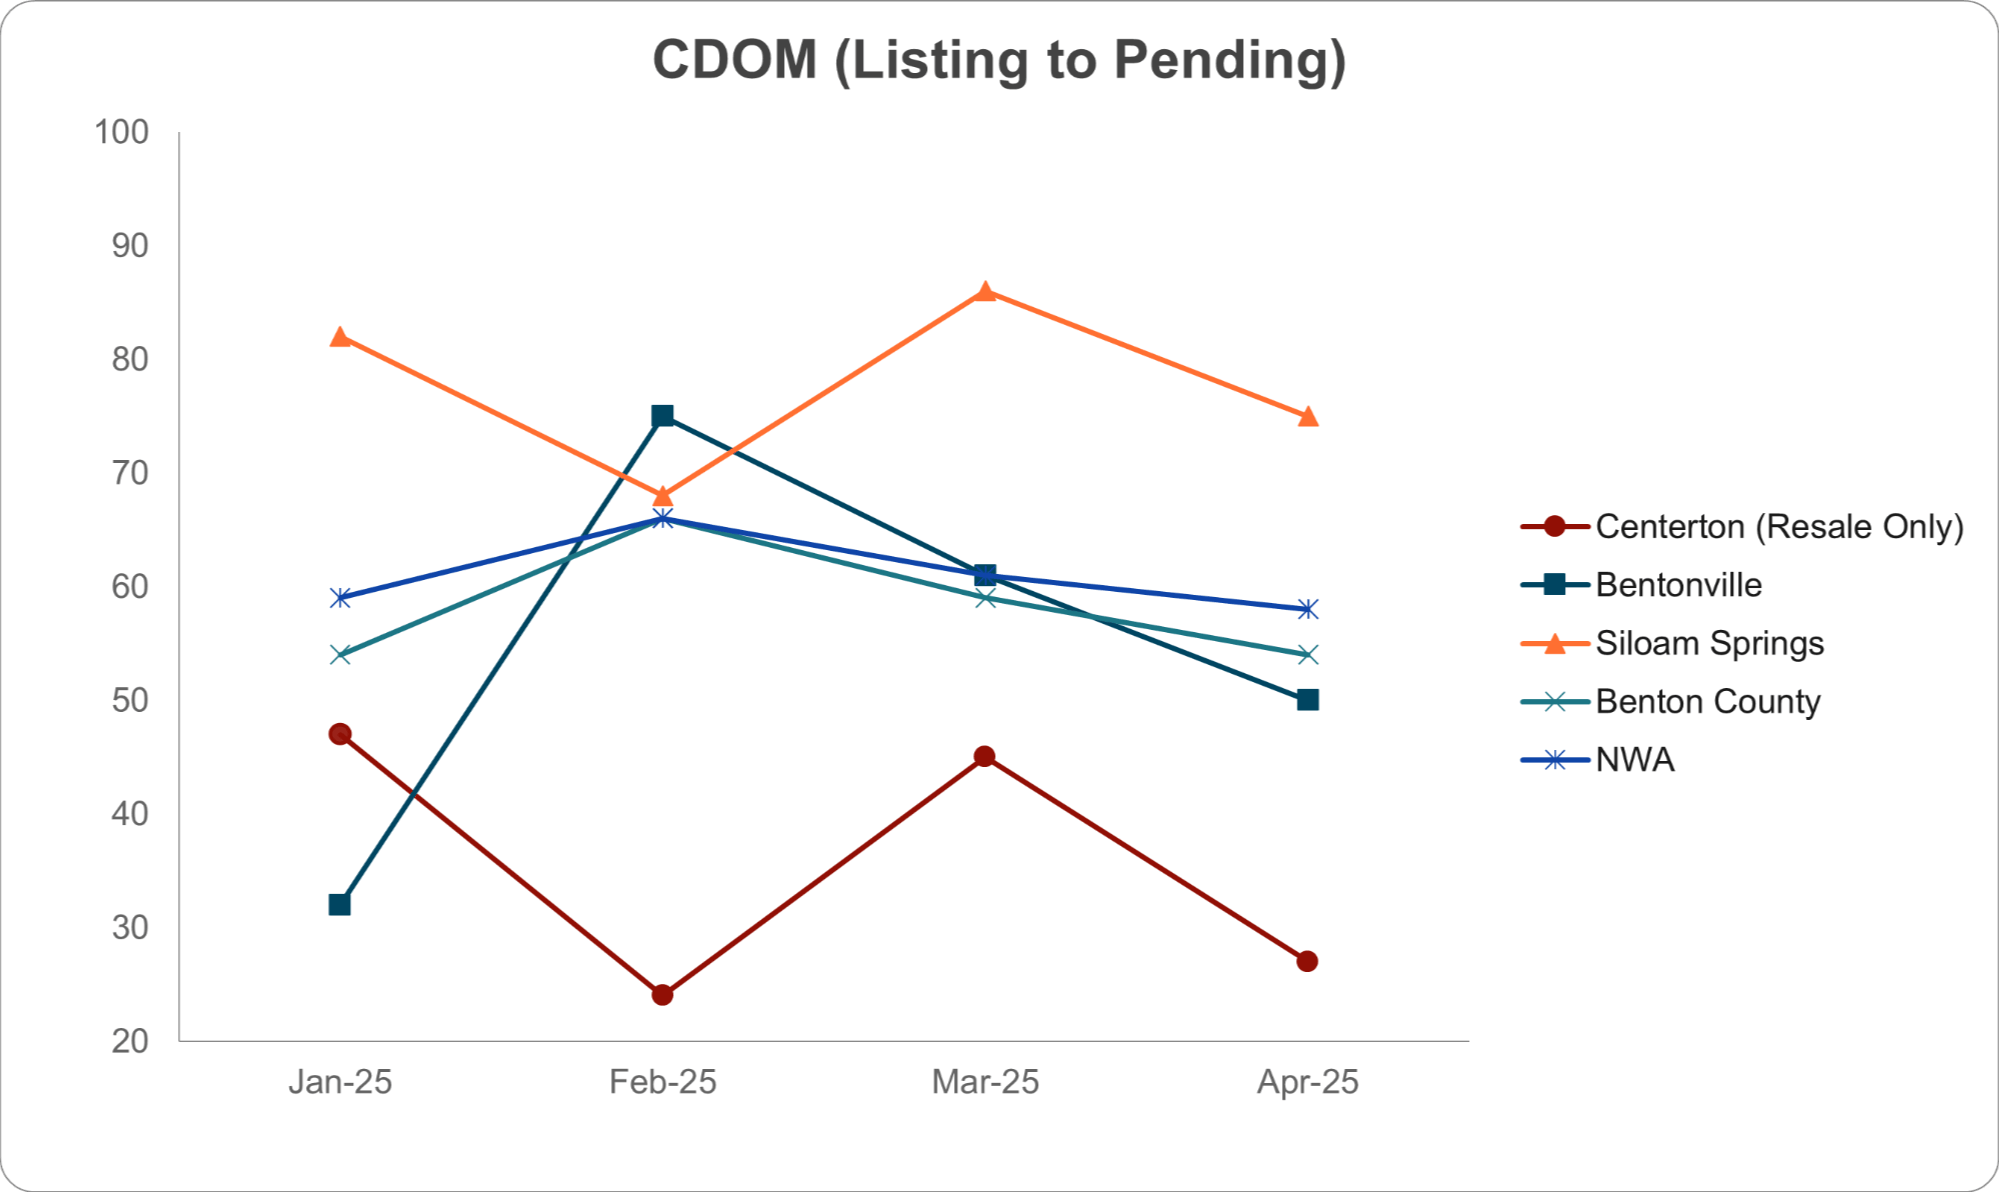
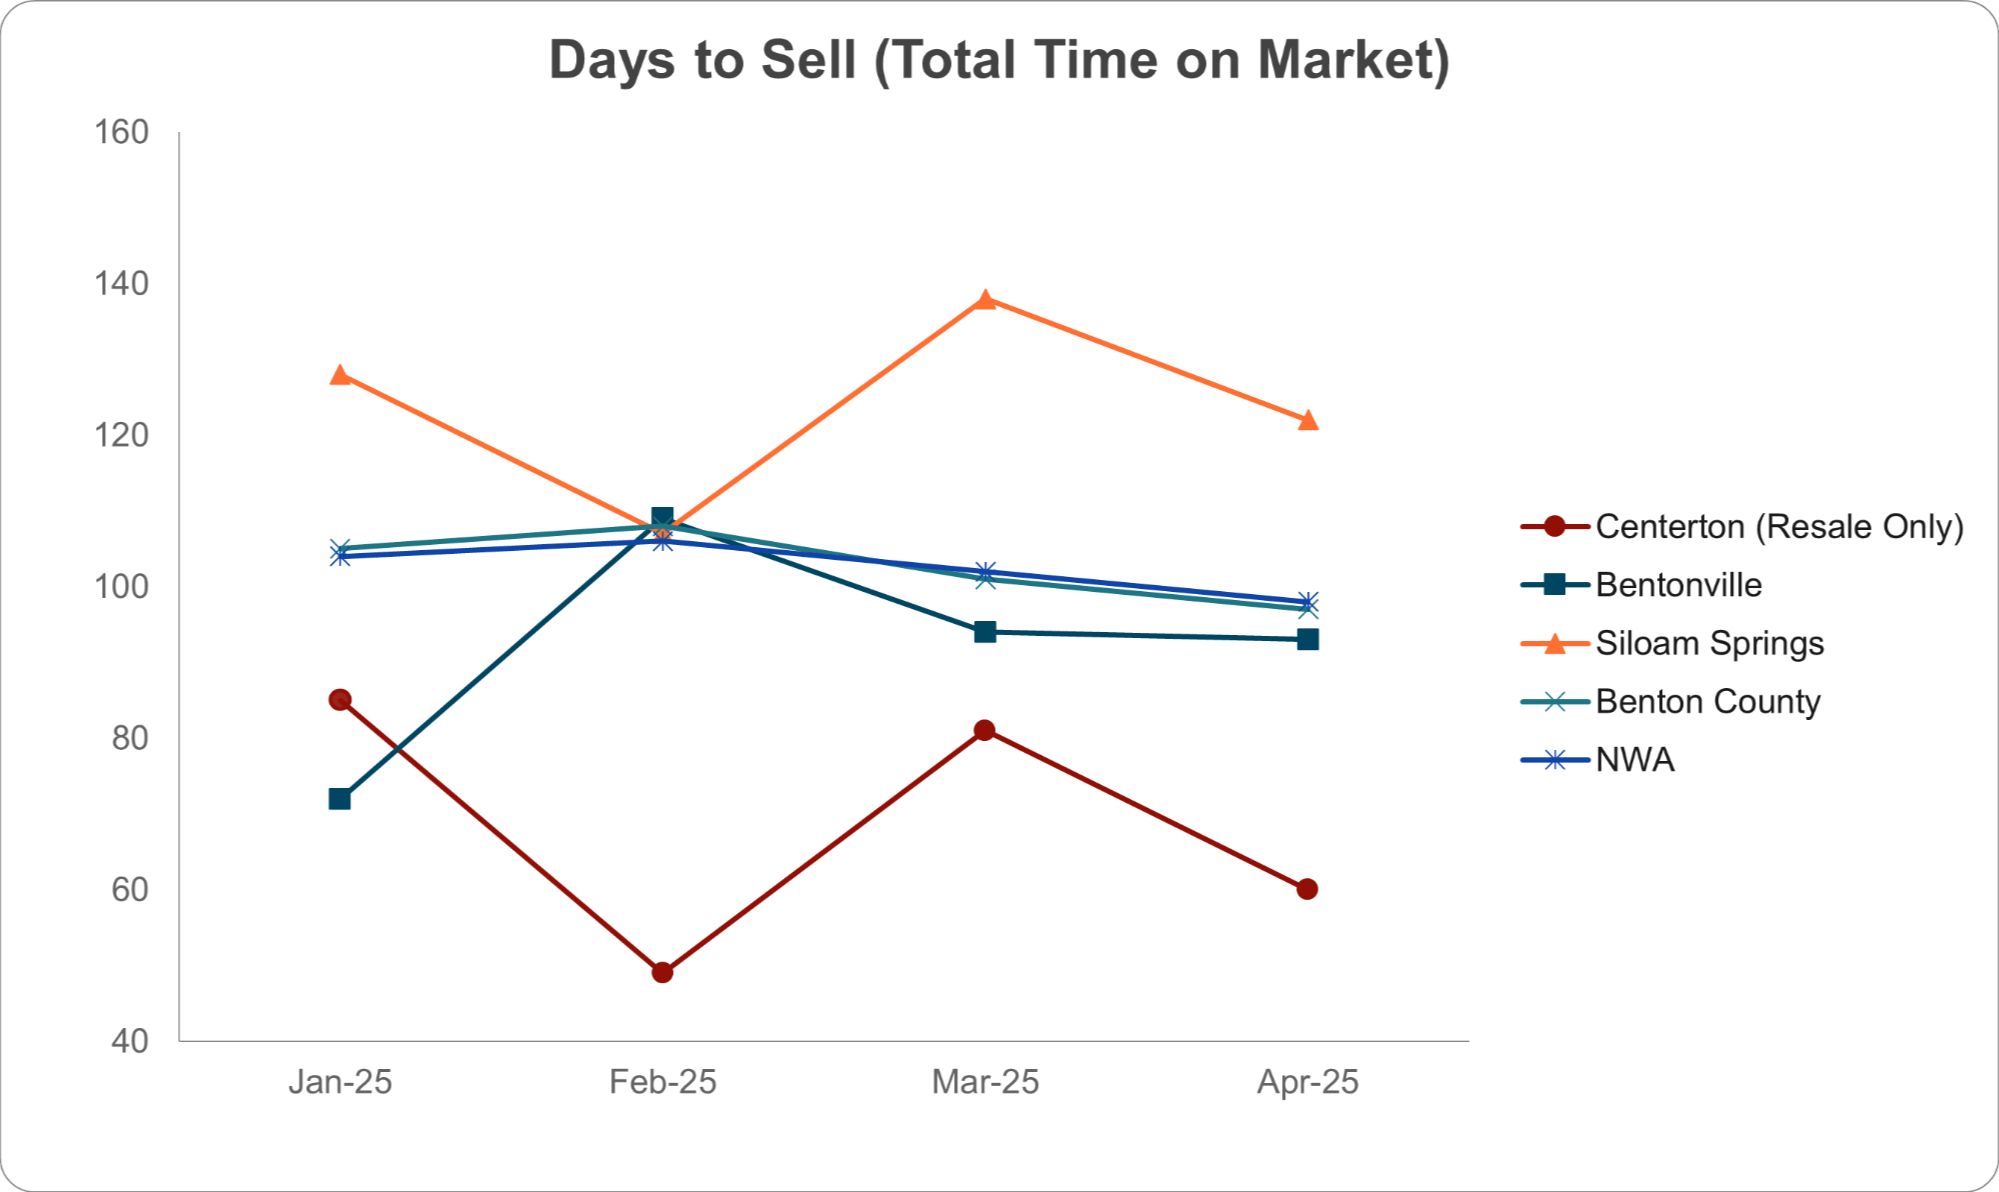
Centerton saw the most dramatic improvement across the board this month. Homes went under contract nearly 30 days faster and closed twice as quickly compared to March. This speed confirms what we’re seeing in the rest of the data—buyer demand is back in full swing, especially for well-prepped listings priced appropriately.
Number of Sales & New Construction Activity
-
Centerton: 48 homes sold in April, up from 35 in March
-
13 of those sold in April were new construction (27% of total sales)
-
-
Bentonville: 110 homes sold in April, down from 135 in March
-
60 of those sold in April were new construction (55% of total sales)
-
-
Siloam Springs: 51 homes sold in April, down from 57 in March
-
29 of those sold in April were new construction (57% of total sales)
-
-
Northwest Arkansas (Benton + Washington Counties): 953 homes sold in April, up from 894 in March
-
316 of those sold in April were new construction (33% of total sales)
-
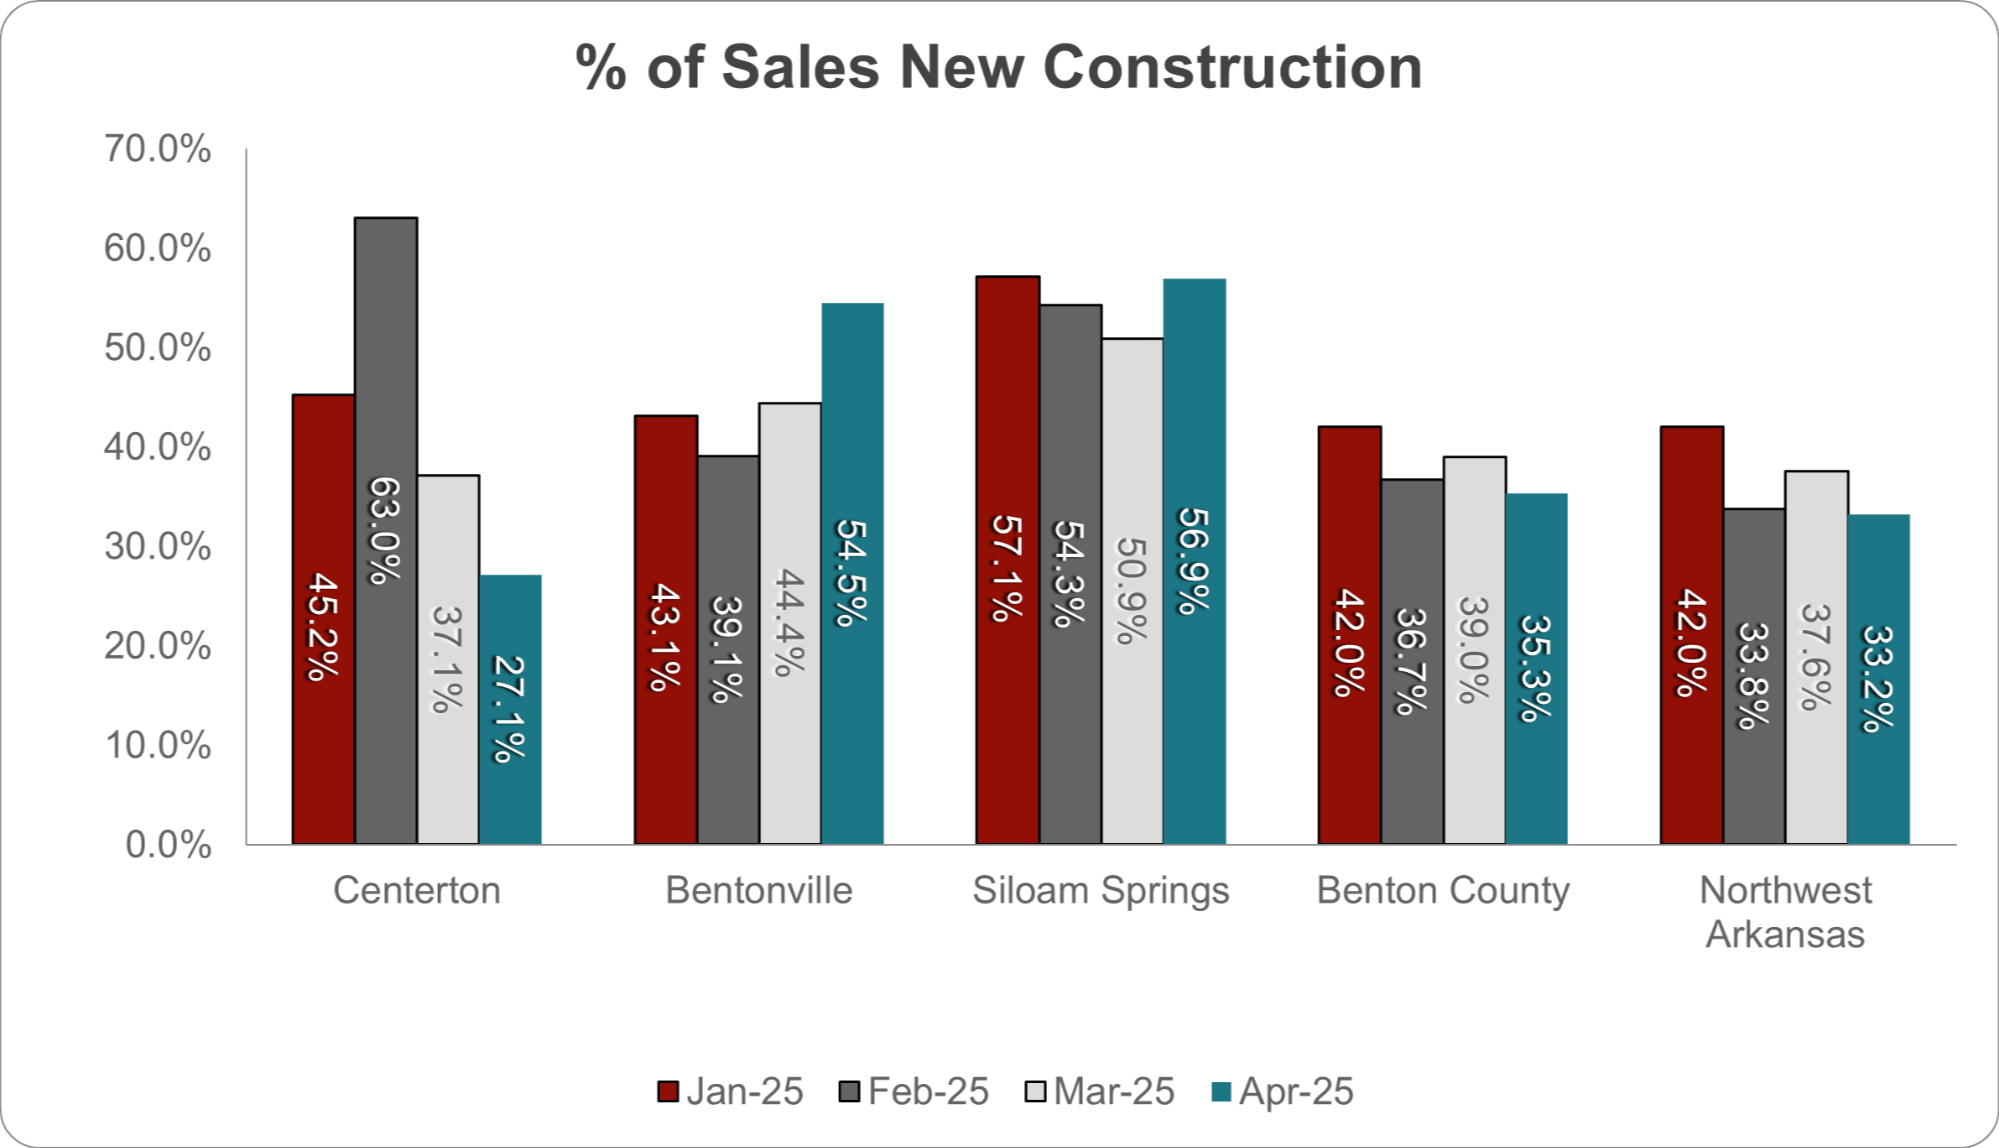
Centerton posted its highest sales month so far in 2025, with 48 homes sold in April—a 37% increase from March. While Bentonville and Siloam Springs saw month-over-month declines, Centerton's consistent growth signals a healthy and competitive local market. New construction made up just over a quarter of total sales, which suggests buyers are not only drawn to brand-new builds but also remain highly active in the resale market.
Months of Inventory
Months of inventory is a key metric calculated by dividing the number of active listings by the number of homes sold. It helps determine who holds the advantage:
-
Seller’s Market: 0-3.99 months (favors sellers)
-
Neutral Market: 4-6 months (balanced)
-
Buyer’s Market: 6+ months (favors buyers)
Currently for the month of April, the division of all cities is as follows:
-
Seller’s Market: Centerton, Bella Vista, Springdale, Centerton Non-New Builds (2022 & older)
-
Neutral Market: Bentonville, Rogers, Siloam Springs, Benton County, Washington County, Fayetteville, NWA as a whole & Centerton New Construction
-
Buyer's Market: N/A for the month of April
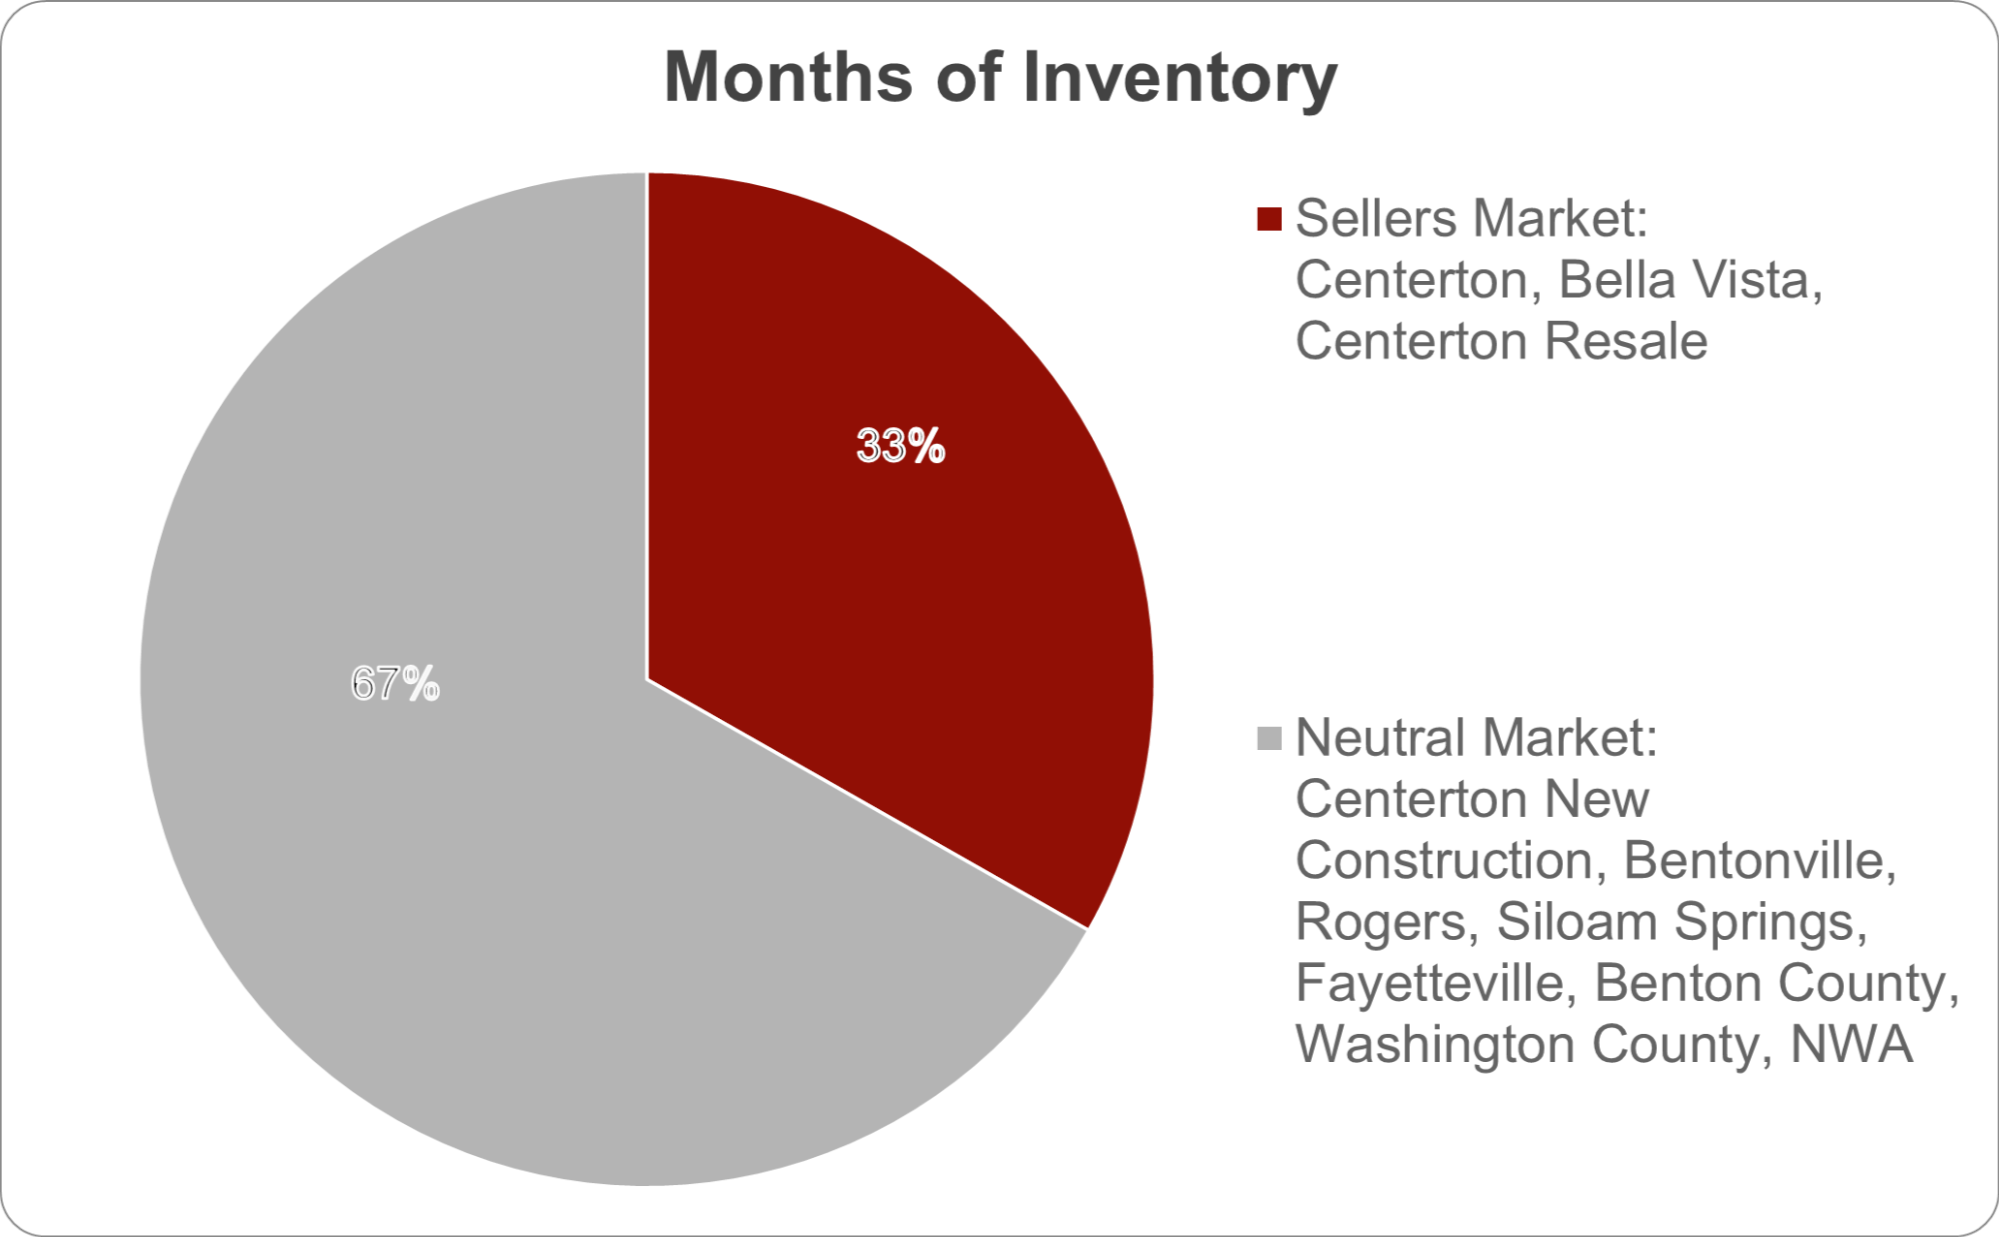
Centerton officially returned to seller’s market conditions in April, following a brief dip into neutral territory in March. This shift was driven by a strong increase in sales volume and a noticeable tightening in available inventory. With a months-of-inventory figure at 3.85, this is the second lowest level Centerton has seen so far in 2025—and a clear indicator of increased buyer urgency. Compared to March’s 5.59 months, the drop reflects how quickly the market can pivot, especially when listings are priced right and move-in ready.
What’s the Takeaway?
Centerton’s April market brought some of the biggest shifts we’ve seen so far this year. From a surge in closed sales and a sharp drop in days on market, to a return to seller-favorable inventory levels, the data confirms what many of us have been feeling—demand is ramping up as we head into summer. Whether you're looking to buy or sell, these trends make it clear: preparation, strategy, and timing matter more than ever in this competitive landscape.
If you’re navigating a real estate decision in Centerton, whether buying, selling, or simply weighing your options, I’m here as a resource. You can reach me directly at allie.verdery@evrealestate.com or visit allieverdery.evrealestate.com. I share updates like this each month, along with weekly insights from Centerton City Council and Planning Commission meetings to help you stay informed.
Together, let’s continue making Centerton an exceptional place to live, invest, and thrive.
Categories
Recent Posts