Centerton’s Housing Market in 2025 (Through August): What the Data Says

As Centerton’s real estate landscape continues to shift in 2025, understanding the story behind the numbers is more important than ever. Whether you're buying, selling, or investing, the data through August offers powerful insights into pricing trends, sales activity, and market dynamics.
As your local Centerton expert, I've analyzed every angle — and here’s what you need to know.
📊 A Note on the Numbers: Why I Now Prioritize Median Over Average
If you’ve followed my past market updates, you may notice something different in how I analyze pricing this year.
I’ve made a deliberate shift away from using averages — and now focus almost exclusively on median prices.
Why the change?
In real estate, averages can lie.
A single $1.2M home closing in a month of $350K–$450K homes will skew the average way higher than what’s actually happening in the broader market. That’s especially true in markets like Centerton, where luxury homes occasionally close in a mostly mid-range environment.
Median = Real Market Pulse
The median price is the middle value — meaning half the homes sold above it, and half below. It’s not distorted by outliers and gives a much truer sense of what a typical buyer or seller is dealing with.
👉 If you’re making decisions about timing, pricing, or investment strategy — median is the metric you should trust.
💰 Median Prices Tell the Real Story
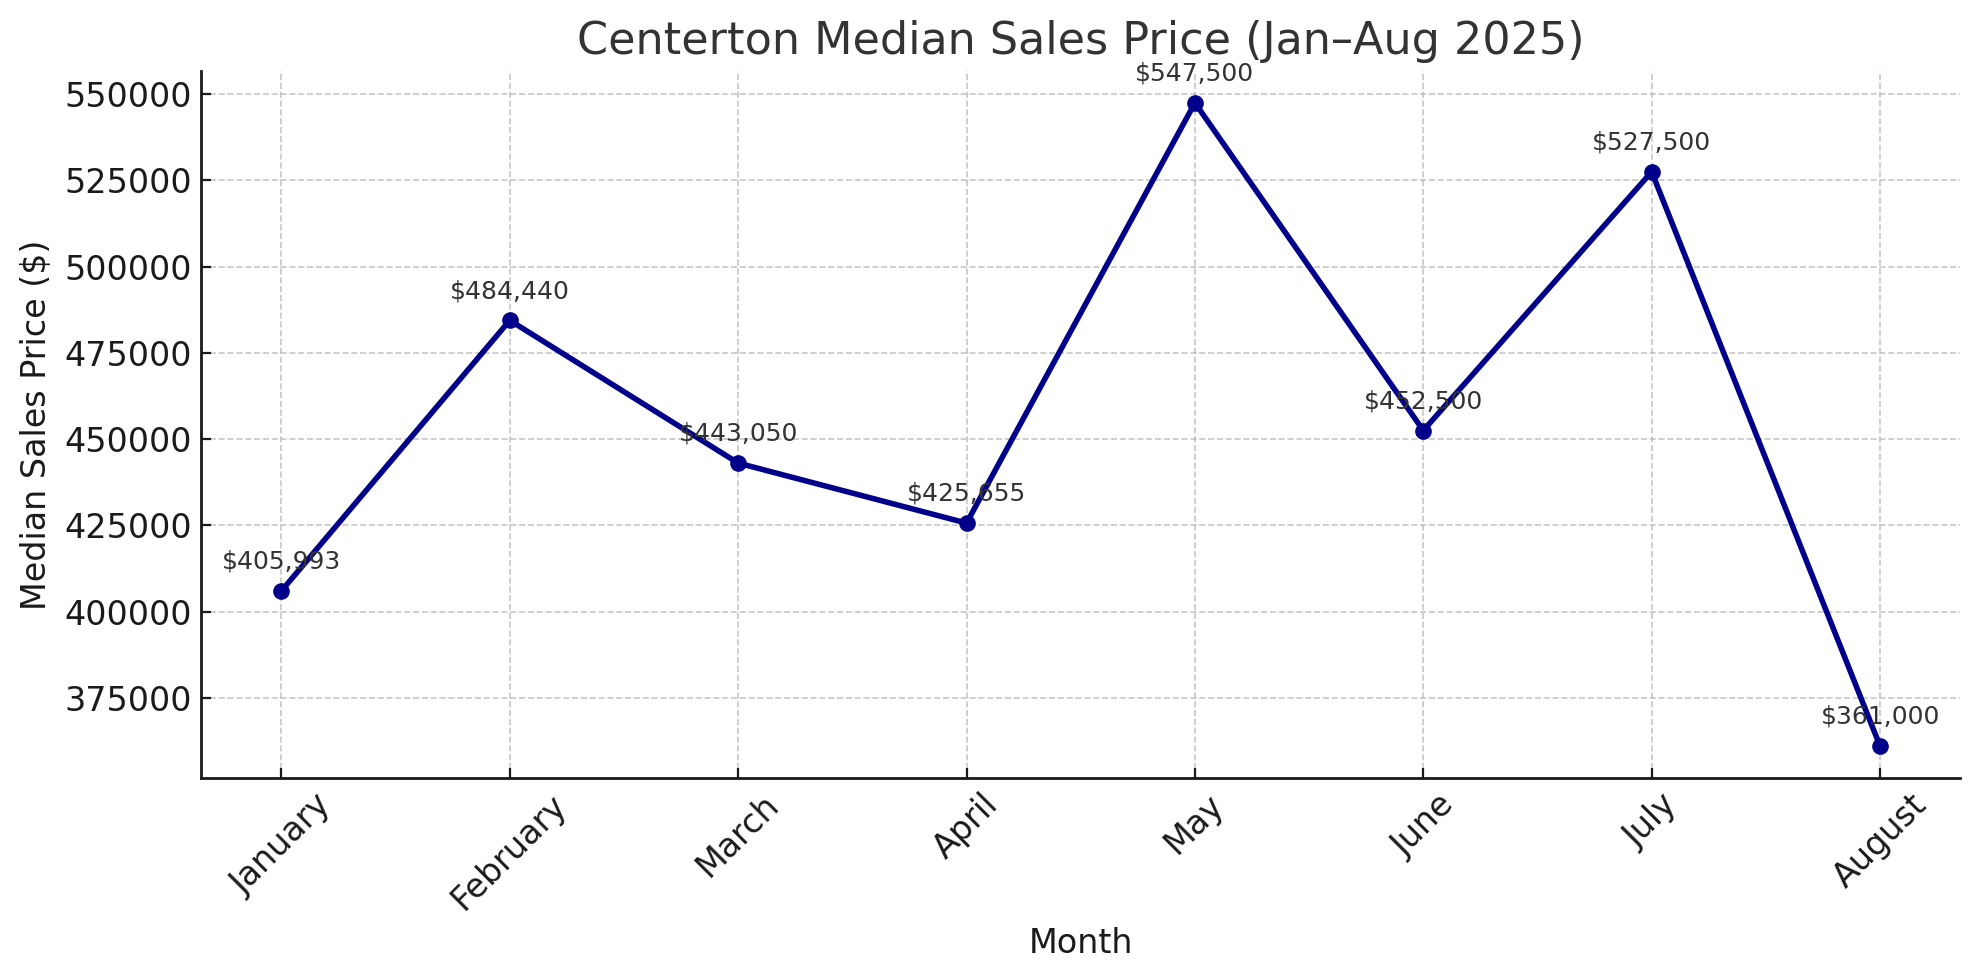
Let’s start with Centerton’s median sales price trend through 2025:
-
January: $405,993
-
May (Peak): $547,500
-
August: $361,000
That’s a $186K+ drop from peak to current — but again, we’re looking at market movement, not collapse.
By August, the decline reflects:
-
Fewer luxury closings
-
Increased competition from builders
-
Buyers gaining leverage with more options
Median list prices remained relatively steady, showing that sellers’ expectations stayed high, even as buyers became more selective.
📏 Price Per Square Foot: Centerton’s Month-by-Month Growth
Let’s talk about price per square foot — one of the clearest ways to understand how the market is valuing individual homes.
Even as overall median home prices have fluctuated, price per square foot has steadily increased — and that tells a different story.
🗓️ Centerton’s Median $/SqFt (Jan–Aug 2025):
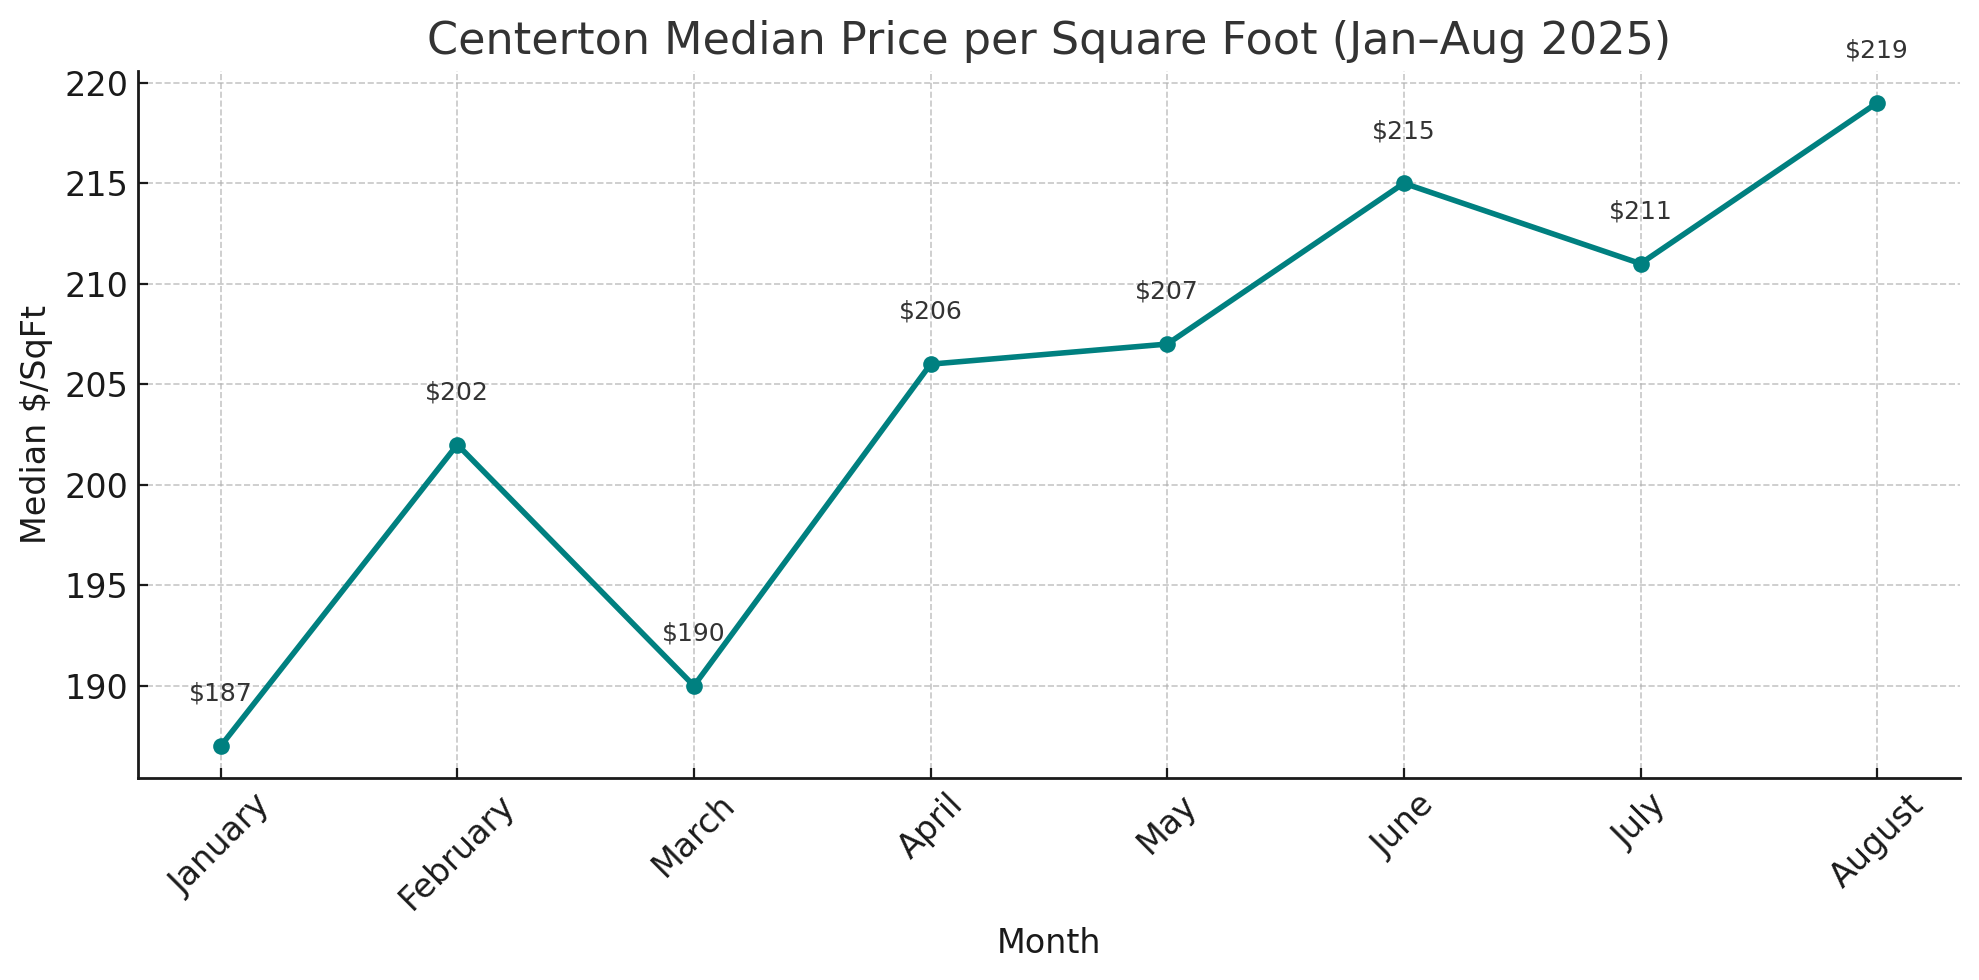
📈 That’s a 17% increase since January — showing that even if home prices dip, buyers are paying more per square foot for efficiency, quality, and location.
As you can see, the trend line is steadily upward, even in months when total home sales prices showed volatility. This suggests confidence in Centerton’s product — especially new builds and well-finished homes.
This reinforces Centerton’s role as a value + quality hub in Northwest Arkansas.
⏱️ Homes Are Selling Faster Than Ever — But Here's the Catch
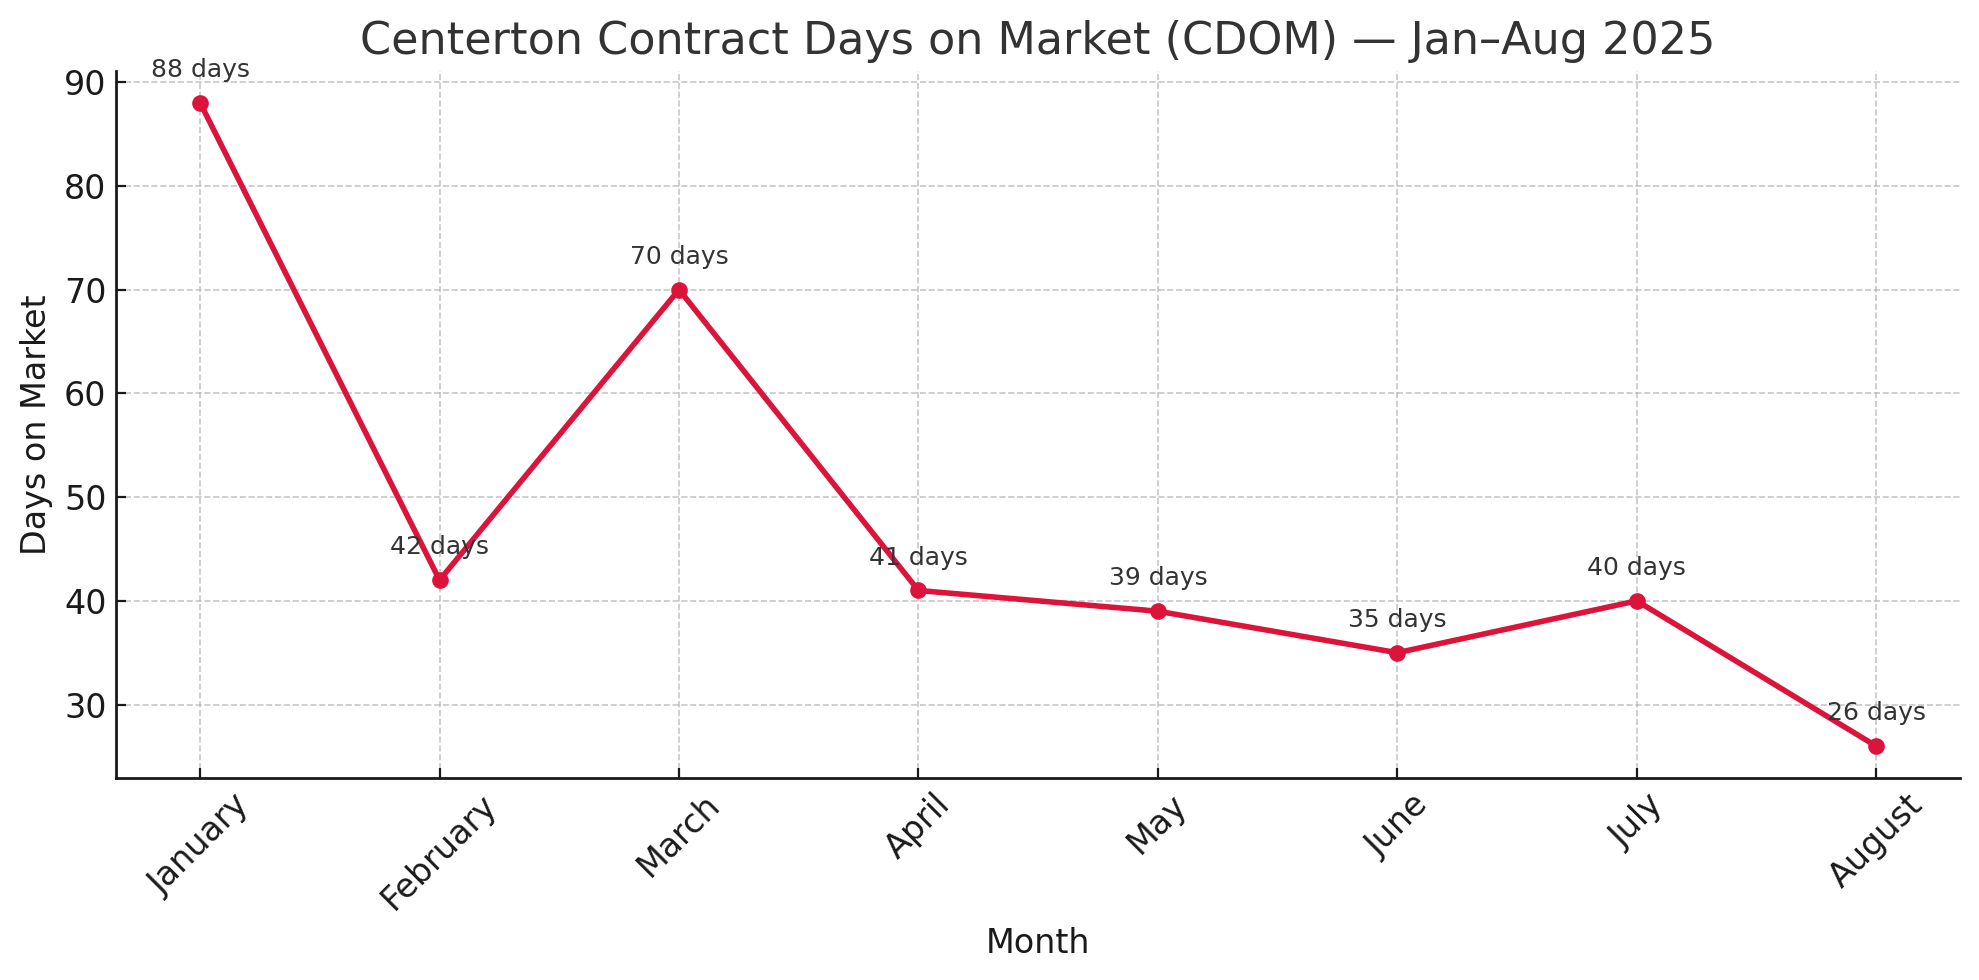
Even with rising inventory, homes in Centerton are selling faster than they were at the start of the year:
-
January CDOM (Contract Days on Market): 88 days
-
August CDOM: 26 days
That’s a 70% decrease in time to go under contract — a strong indicator that:
-
Buyers are still active
-
Priced-right homes are moving quickly
-
Overpriced homes, however, still sit
🛠️ But There’s a Qualifier:
Part of January’s higher CDOM can be explained by the larger share of new construction homes sold that month. Builders often list homes 60–90 days before they're finished, which inflates days on market even though the buyer may have gone under contract early in the build process.
So while August's low CDOM reflects real-time buyer urgency, January’s high CDOM doesn’t necessarily mean homes were sitting unwanted — it’s more a reflection of new build timing.
👉 Moral of the story? Context matters. And Centerton’s homes are moving fast when priced right — especially existing homes or completed new builds.
🧱 What’s Happening With New Construction?
🏗️ New Builds Are Down Sharply Since April
From January through May, new construction homes made up 41–63% of Centerton’s monthly sales.
But since April — when Centerton placed a hold on new building permits — that number has plunged:
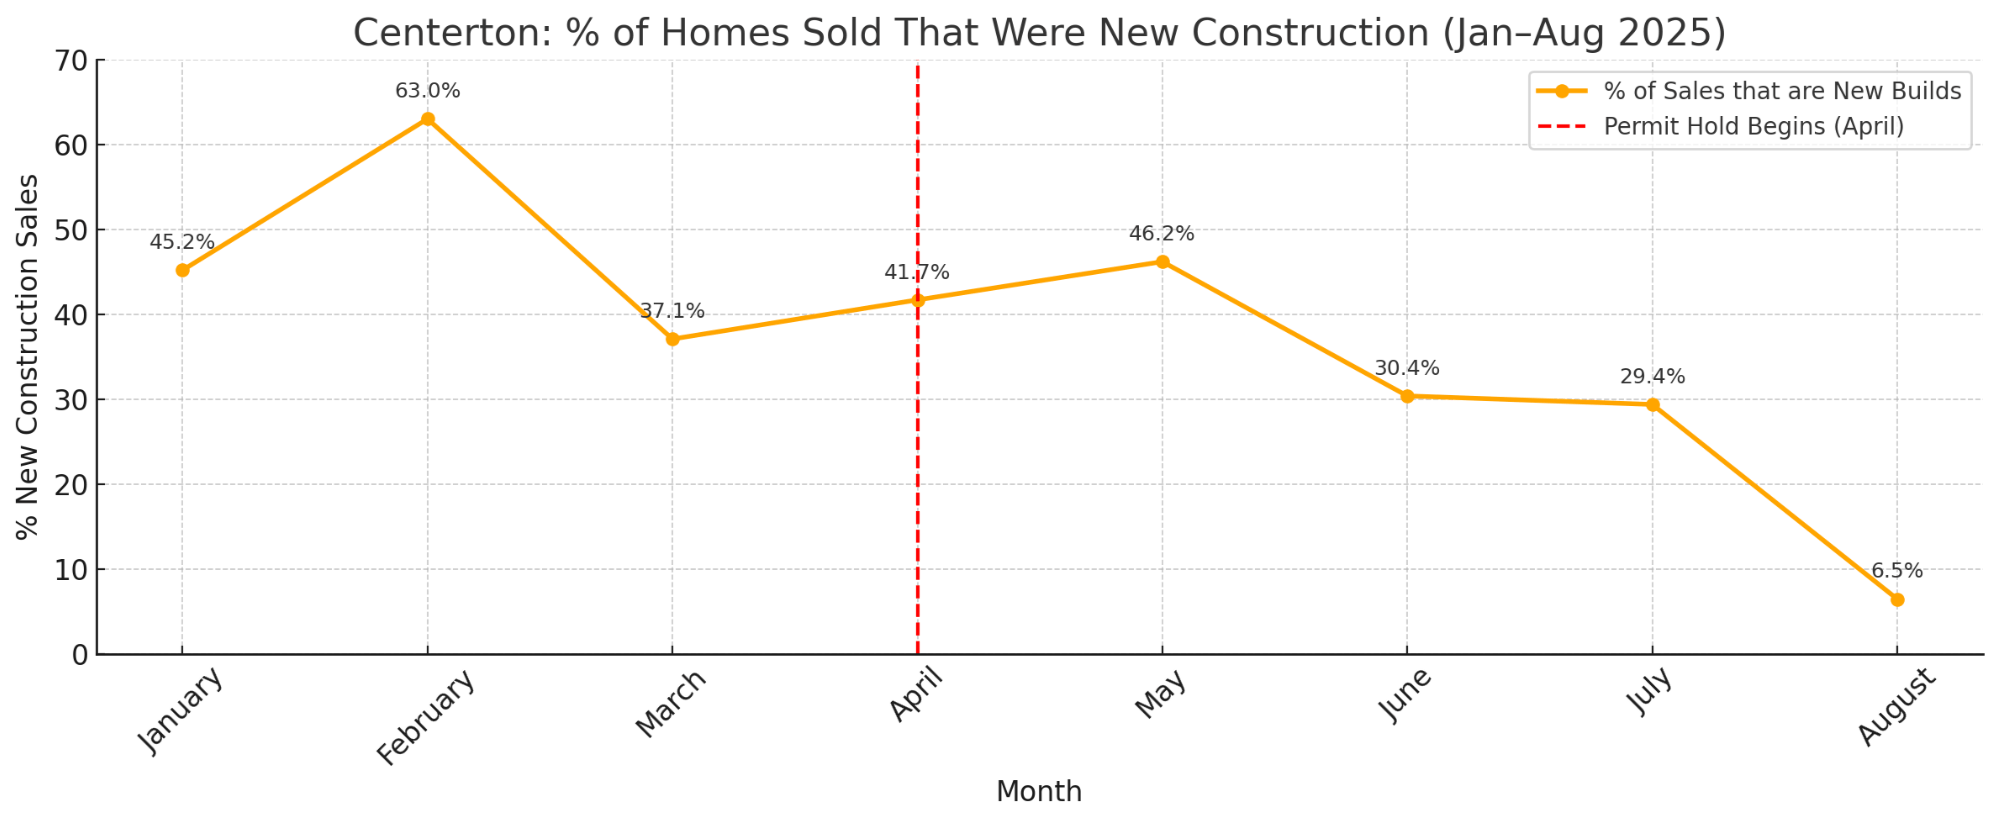
📉 From nearly half of all sales to just 6.5% — that’s a dramatic drop in just three months.
🔍 Why It Matters
-
Permit delays = no new starts, which means the pipeline is drying up
-
Buyers looking for move-in-ready new builds will find more limited inventory
-
Remaining new homes may see increased demand and pricing stability
-
Resale homes — especially newer or updated ones — are now more competitive than ever
- See my blog on the Special Meeting with the Water Department here but the latest update is hopeful relief to the temporary moratorium by EOY.
👉 This is a key market shift — and it affects buyer expectations, pricing strategy, and even appraisal comps.
📦 Months of Inventory: From Balanced to Buyer-Favored
Centerton started the year with 3.5 months of inventory — which is considered a balanced market.
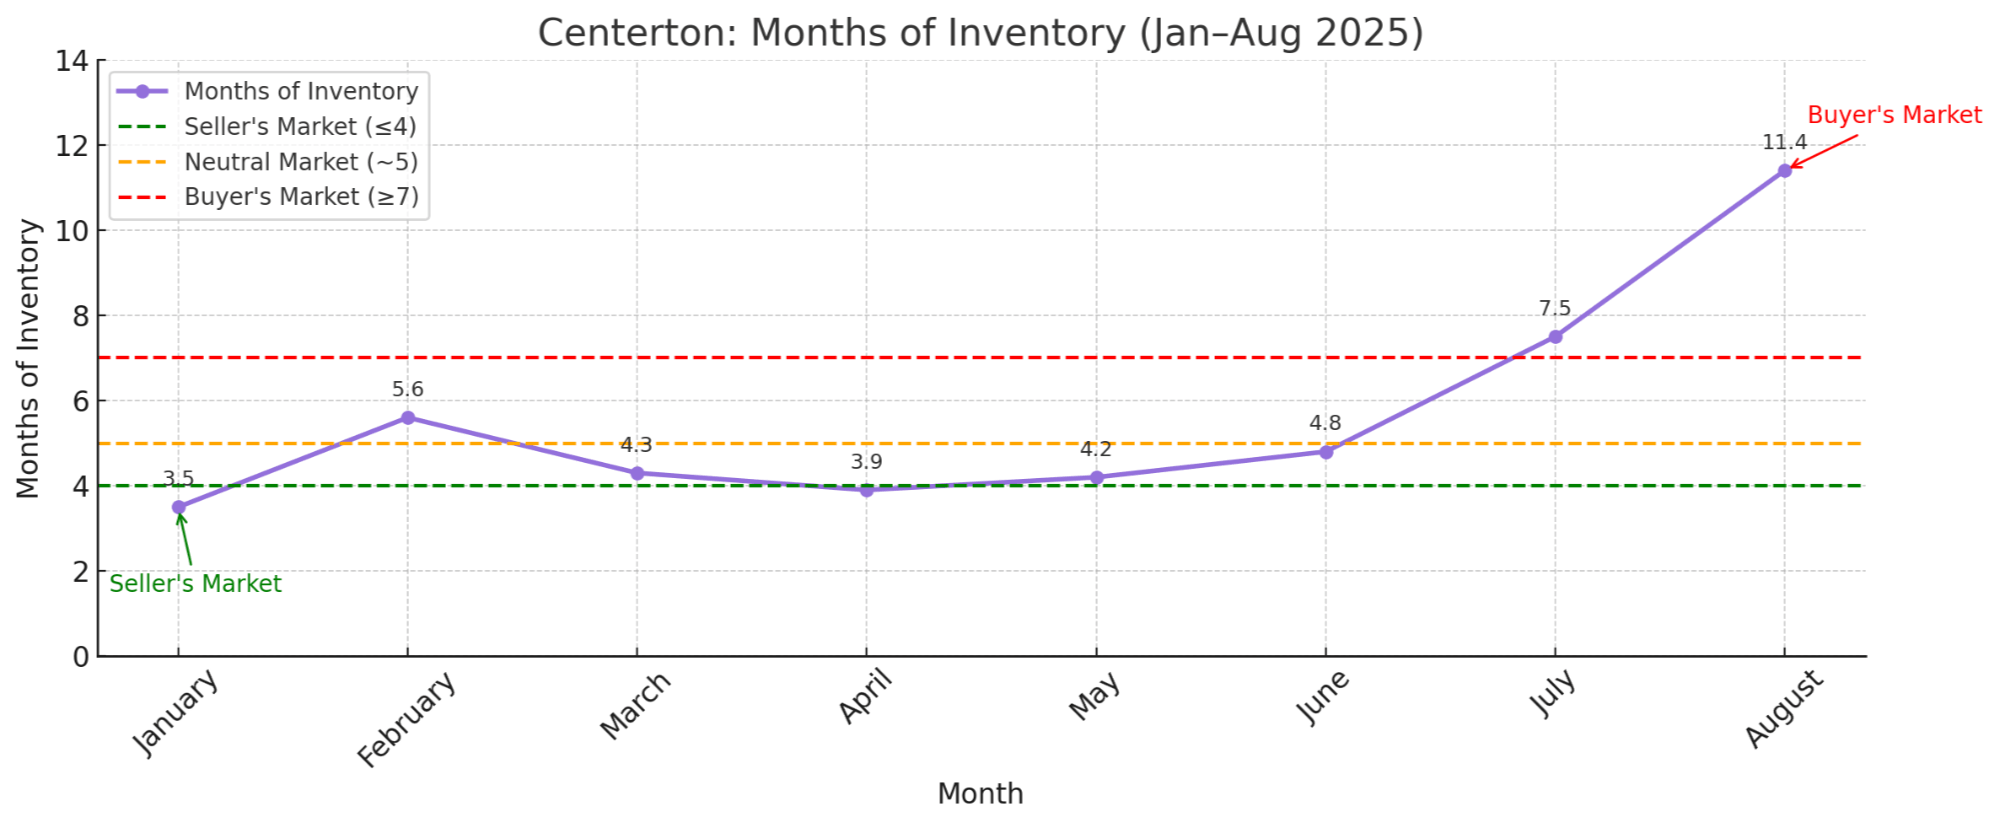
By August?
11.4 months of inventory
📉 That’s a strong buyer’s market by definition.
Why the surge?
-
Listings rose (307 active in August)
-
Closings fell (just 27 homes sold)
This tells us that supply is outpacing demand, giving buyers room to negotiate and sellers incentive to price smartly.
📍 How Centerton Compares to NWA (August 2025)
| Metric | Centerton | Bentonville | Both Counties (Benton + Washington) |
|---|---|---|---|
| Median Price (Aug 2025) | $361,000 | $438,951 | $380,000 |
| Median $/SqFt (Aug 2025) | $213 | $228 | $211 |
| % New Builds (Aug 2025) | 6.5% | 36.1% | 32.2% |
| CDOM (Aug 2025) | 26 days | 41 days | 49 days |
📍 Key Takeaways from August 2025:
-
Centerton is still the among the most affordable market in NWA, both in total price and $/SqFt.
-
New construction made up just 6.5% of sales in Centerton — far below the regional average — due to the ongoing permit hold.
-
Despite fewer new builds, Centerton homes sold the fastest in August, reflecting strong buyer demand for move-in-ready options.
-
Regionally, the NWA market is trending toward balance, but Centerton's affordability keeps it competitive.
🎯 What This Means for You
💼 Buyers
-
✅ More listings than ever
-
✅ More time to choose
-
✅ More room to negotiate
-
⚠️ Fewer new builds = act fast when one hits the market
🏡 Sellers
-
✅ Still possible to sell quickly if priced right
-
❌ Overpricing = longer DOM and price reductions
-
🎯 White glove marketing and presentation matter more than ever — high-quality photography, staging, and strategic pricing can make all the difference in standing out among rising inventory
🗣️ Final Thoughts from Your Centerton Expert
What we’re seeing in Centerton is not a crash — it’s a recalibration. The market is shifting toward balance, offering opportunities on both sides of the table.
For buyers, it’s time to act strategically. For sellers, it’s time to lean into polished marketing, smart pricing, and professional guidance.
📉 And yes — the Fed just dropped rates this week.
That doesn't mean mortgage rates will drop overnight, but it does open the door for some stabilization in the near term. Mortgage-backed securities tend to take 1–2 weeks to settle after rate changes, so I recommend checking back in two weeks once volatility calms.
➡️ Will we see 3% again? No.
➡️ But will we possibly see low 6’s or even high 5’s this fall? It’s on the table.
This could unlock pent-up demand from rate-sensitive buyers and bring more people back into the market — especially in places like Centerton where affordability already leads the region.
Allie Verdery
The Blue Haired Broker
Engel & Völkers Bentonville
Your Local Centerton Expert
📌 Don’t forget to bookmark this blog!
I regularly post updates on the outcomes of Centerton City Council and Planning Commission meetings, so you’re always ahead of zoning changes, permit holds, and development updates that affect your home’s value and neighborhood trajectory.
Categories
Recent Posts